Let’s talk about A/B testing.
Specifically, we’ll consider an enhancement to their direct messaging service. Check out this proposal by Dan Vang.
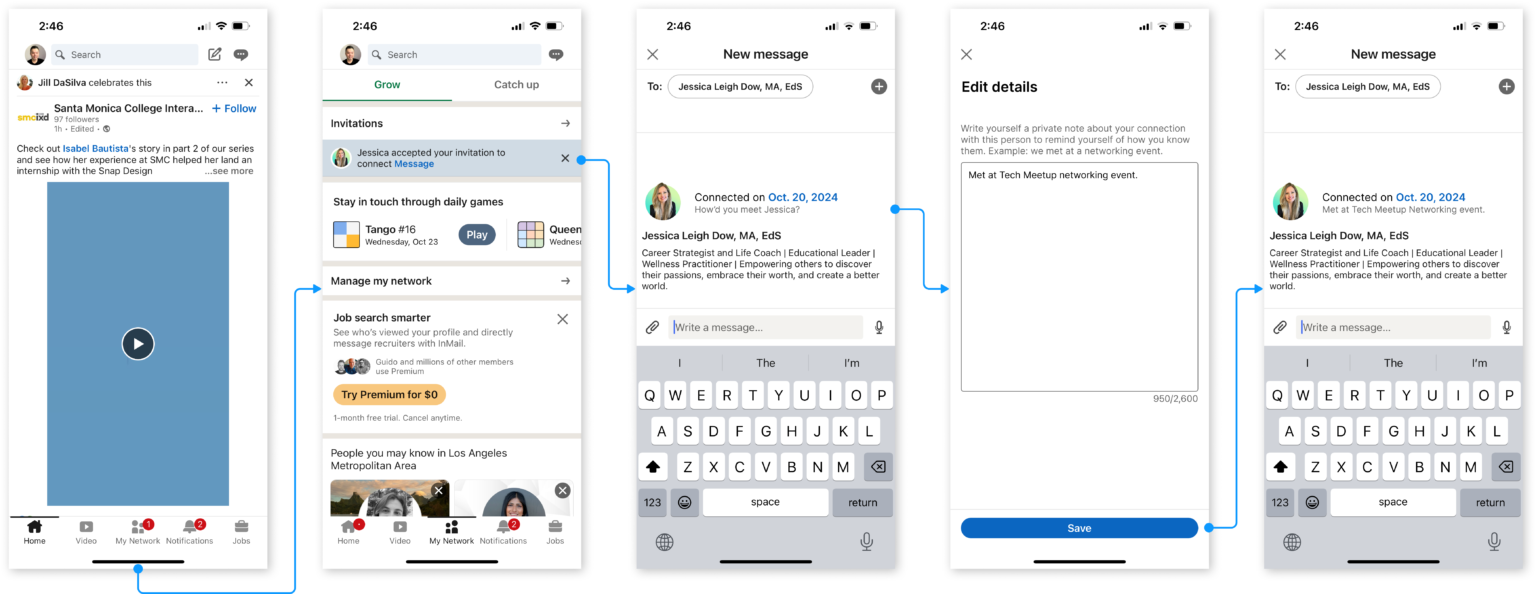
Essentially, the idea is to insert a field where a user can privately add a short blurb to contextualize their connection to another user.
LinkedIn’s Process
Typically rolling out a new feature on any social networking site requires collecting metrics to demonstrate it’s impact and utility for users. In this article we will run through this vetting process.
LinkedIn has a robust A/B testing methodology developed over years as the world’s leading professional networking site. This 2015 article (Xu et al. 2015) details early scaling solutions. And this (Ivaniuk and Duan 2020b) pair (Ivaniuk and Duan 2020a) of 2020 bog posts lay out their mature infrastructure and methodology for A/B testing, called LinkedIn Targeting, Ramping, and Experimentation platform, or T-REX. All this preparation yields impressive scaling capabilities, supporting 2,000 new experiments per week (as of the 2020 post).
Testing Considerations
There are a number of considerations to address when designing a test. We’ll break them down into user segmentation and clustering, test conflicts, and timeline.
Clustering and Segmentation
There are many ways users may be segmented on a social platform like LinkedIn. Consider the many user types on the platform:
- Job Seekers/Professionals
- Recruiters
- Influencers
- Sales & Marketing Specialists
- NGO/Nonprofit Workers
- Entrepreneurs/Startups
- Corporate Managers
However, natural clusters may not respect these nice categories. Managers and professionals within the same company may be highly networked, whereas professionals in different specialties (Materials Science vs Data Science) may be completely disjoint.
The definition of `Natural Clusters’ in this context may not be so straightforward, but any good A/B testing would either assert user independence (IE Stable Unit Treatment Value Assumption (SUTVA)) or find a methodology to address that issue.
Since our feature relates to user interactions, it would be wise to consider user clusters as the unit users would be randomized by and assigned treatment groups. This strategy is designed to limit the event of spillover from one treatment group to another. With this approach we must be careful in our estimation of parameters as user selection into treatment groups is affected. Users placed in treatment groups remains a random variable with the same probability distribution, but those random variables are no longer independent of each other.
Conflicts
- Although LinkedIn allows for overlapping experiments, we would like to avoid intersecting with other experiments on messaging to avoid confounding factors.
- Disjoint:
- Direct Messaging Service attributes. EG: DM notifications, look and feel updates, LinkedIn inmail sponsored messages.
- Independent:
- Non Direct Messaging Service features. Other notifications, feed updates, etc.
- Changing browser types. Every effort should be made to maintain a smooth operating experience between different browsers, however, users switching browsers could be a complicating factor. It could also provide valuable information on which formats provide the best outcomes.
Timeline
We should include a reasonable burn-in period for a novel feature such as this.
Typical A/B testing cycles run on a timeline of a minimum of 2 weeks to a maximum of 6 - 8 weeks. We will assume a round 8 weeks.
Ideally we would like to know the impact over a longer timeline. However, for business and experimental control reasons we would like to conclude on a quicker timeline, thus we can use adoption as a proxy on the assumption that memory aids will improve engagements between loosely connected members.
KPIs and Statistics
Now time for the fun stuff.
There are many possible KPIs we could utilize for the above aspects we would like to measure. For ease of exposition, we will suggest simple KPIs for each of the above.
Utilization KPIs
- Adoption.
- Tracking users who use the feature when it becomes available to them, a higher adoption rate suggests more users find it relevant.
\[ A = \frac{\#\text{users who used the feature at least once}}{\#\text{users exposed to the feature}} \]
- Frequency.
- Measure total number of uses over the course of the trial. Higher frequency of use implies each user finds value in the feature over many connections. As use of the feature is dependent on entering the messaging window, an opportunity would be defined as entering a messaging window where the summary is not yet filled in. \[ F = \frac{\#\text{ times feature is used.}}{\#\text{opportunities to use the feature.}} \]
- Retention.
- Check that users return to the feature over a specified time span. This indicates the user found value for the feature in the past and creates a stickier environment for the user. As we will observe just over the course of several weeks, we will test with a 7 day retention window. \[ R = \frac{\#\text{users who used the feature 7 days after their first use.}}{\#\text{users who used the feature.}} \]
A/B testing KPIs:
- Direct Messages
- As our feature lives in the direct message service, this would be the primary effect we would like to investigate. \[ M = \frac{\#\text{Direct Messages}}{\#\text{Users with context.}} \]
- Engagement
- A secondary effect of providing context to peers is a change in engagement, measured in likes, comments, and shares. \[ E = \frac{\#\text{Likes + Comments + Shares}}{\#\text{Impressions}} \]